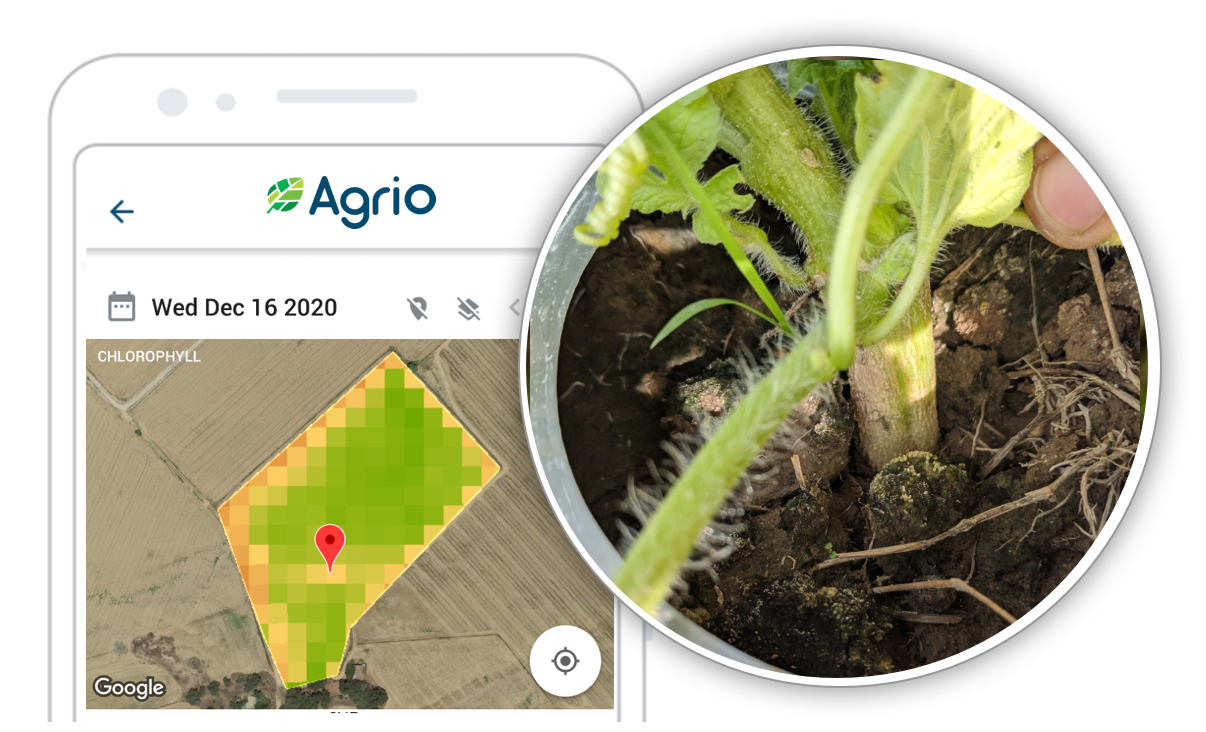
A crop monitoring app that helps to monitor crop progress and spot problems in the field before symptoms are apparent is crucial for a successful harvest. In this article, we want to discuss how mapping the spatial variability of leaf chlorophyll content (LCC) within fields can help in spotting plant health problems and differing quantities of nitrogen fertilizer application.
The leaf chlorophyll content is an important indicator of plant health, photosynthetic potential, and nutritional state. Although extraction analysis by field sampling provides an accurate estimation of LCC status, such methods are not practical. Non-destructive remote sensing measurement offers an affordable, and frequent way to monitor crops and assess the LCC of plants over fields in high resolution.
The leaf nitrogen content is strongly correlated with chlorophyll content. The optimum rate and application timing of nitrogen fertilizer is crucial in achieving a high yield. Monitoring the chlorophyll index allows variable-rate fertilizer application and site-specific crop management.
Weather and soil conditions are major factors in the rate at which nitrogen is escaping the soil system to the atmosphere, and therefore the fertilization needs cannot be easily predicted. New ways to observe fields can reduce the grower guesswork when mid-season fertilizer application decisions are made, it is an important decision since the costs of nitrogen can make the difference between a profitable season to an unfavorable one
Why the normalized difference vegetation index (NDVI) is not suitable for this task? NDVI shows a low correlation with the chlorophyll content, it is more severe in advanced growth stages when the NDVI becomes saturated. This saturation is due to the increase in the leaf area, and the density of the canopy structure. In this stage, there is a need to monitor an index that is highly correlated with the leaf chlorophyll content and less sensitive to the leaf and canopy structure.
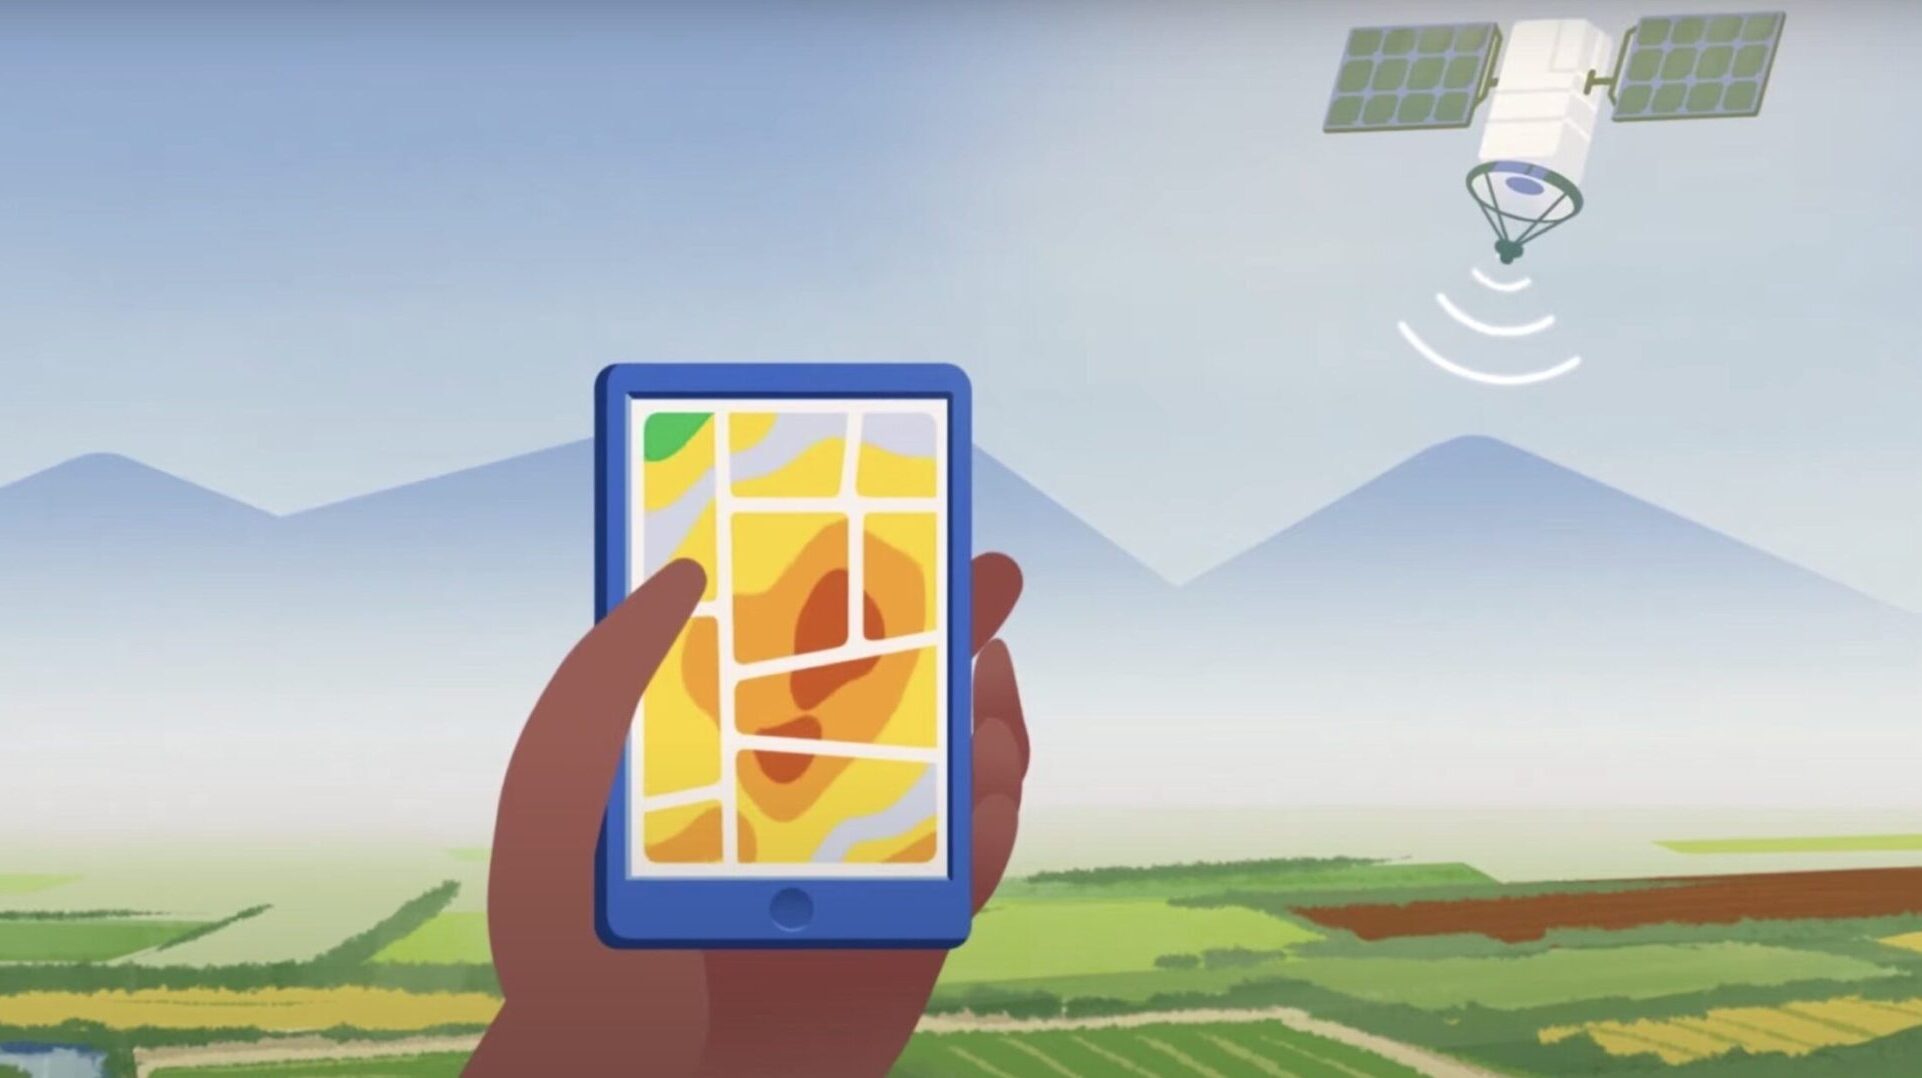
Farmers that are using Agrio can monitor crops and the chlorophyll index of their fields in a very simple way. All that is needed is to define the field location by drawing a polygon that represents the field boundary. Once this is done we are kicking in to do constant monitoring of your crop for you, and notify you when a new scan is available.
We expect a scan to be available every few days, but when the sky is cloudy a clear shot of the field is not possible and we need to wait for the next time that the satellite is passing above your field. On our platform, you can get access to Sentinel and Planet scope satellite scans. With Sentinel we are able to provide 10-meter resolution scans with 3-5 days revisit frequency. PlanetScope is one of the satellite constellations operated by Planet. With daily revisits and 3-meter resolution, we can better deal with cloud interference and track the changes in the fields more closely.
We do the image analysis and alert you when we find anomalies.
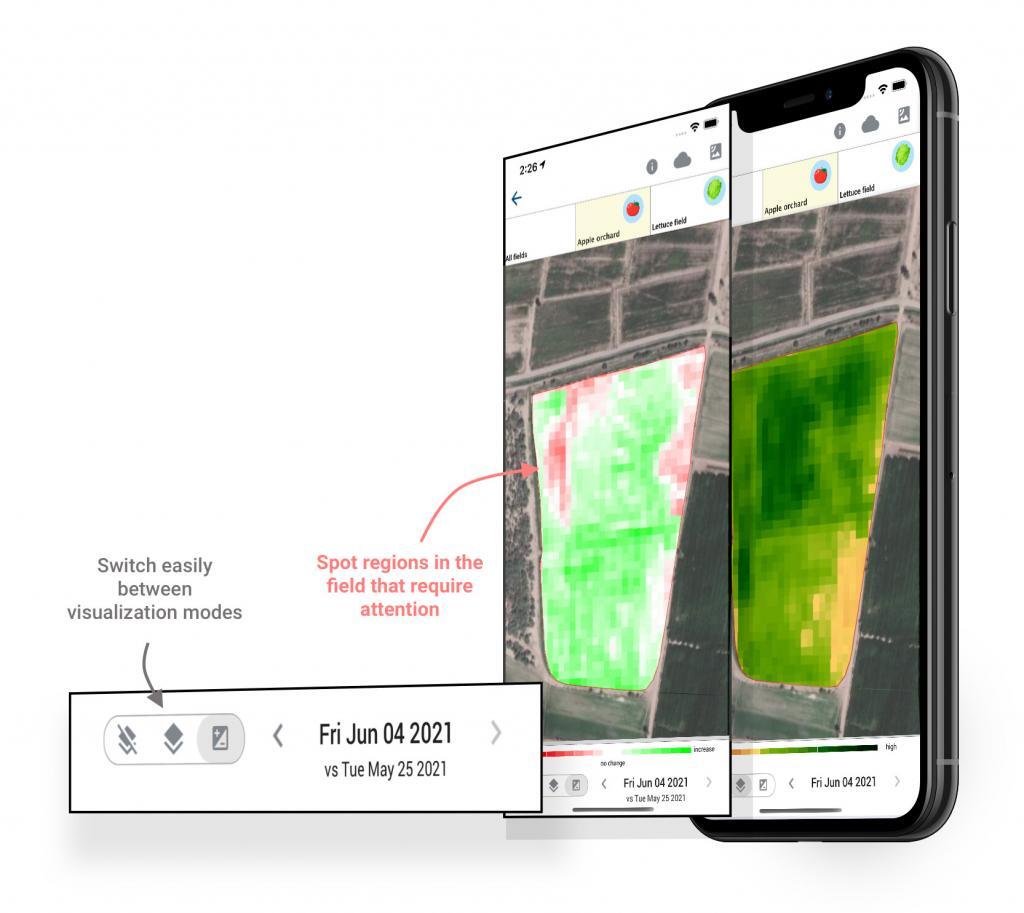
Wondering how your last field intervention affected the plants? Did you manage to improve the health of the plants? Do the leaf area and chlorophyll concentration show improvement? You can monitor such changes by selecting the “compare” tab. We compare your subsequent satellite scans to show you the change in a 3-5 days resolution.
Take a big leap forward in your farming practices by engaging with the Agrio remote sensing technology. We are looking forward to helping you monitoring your crop.
In the meantime, as always, we wish you an abundant harvest.