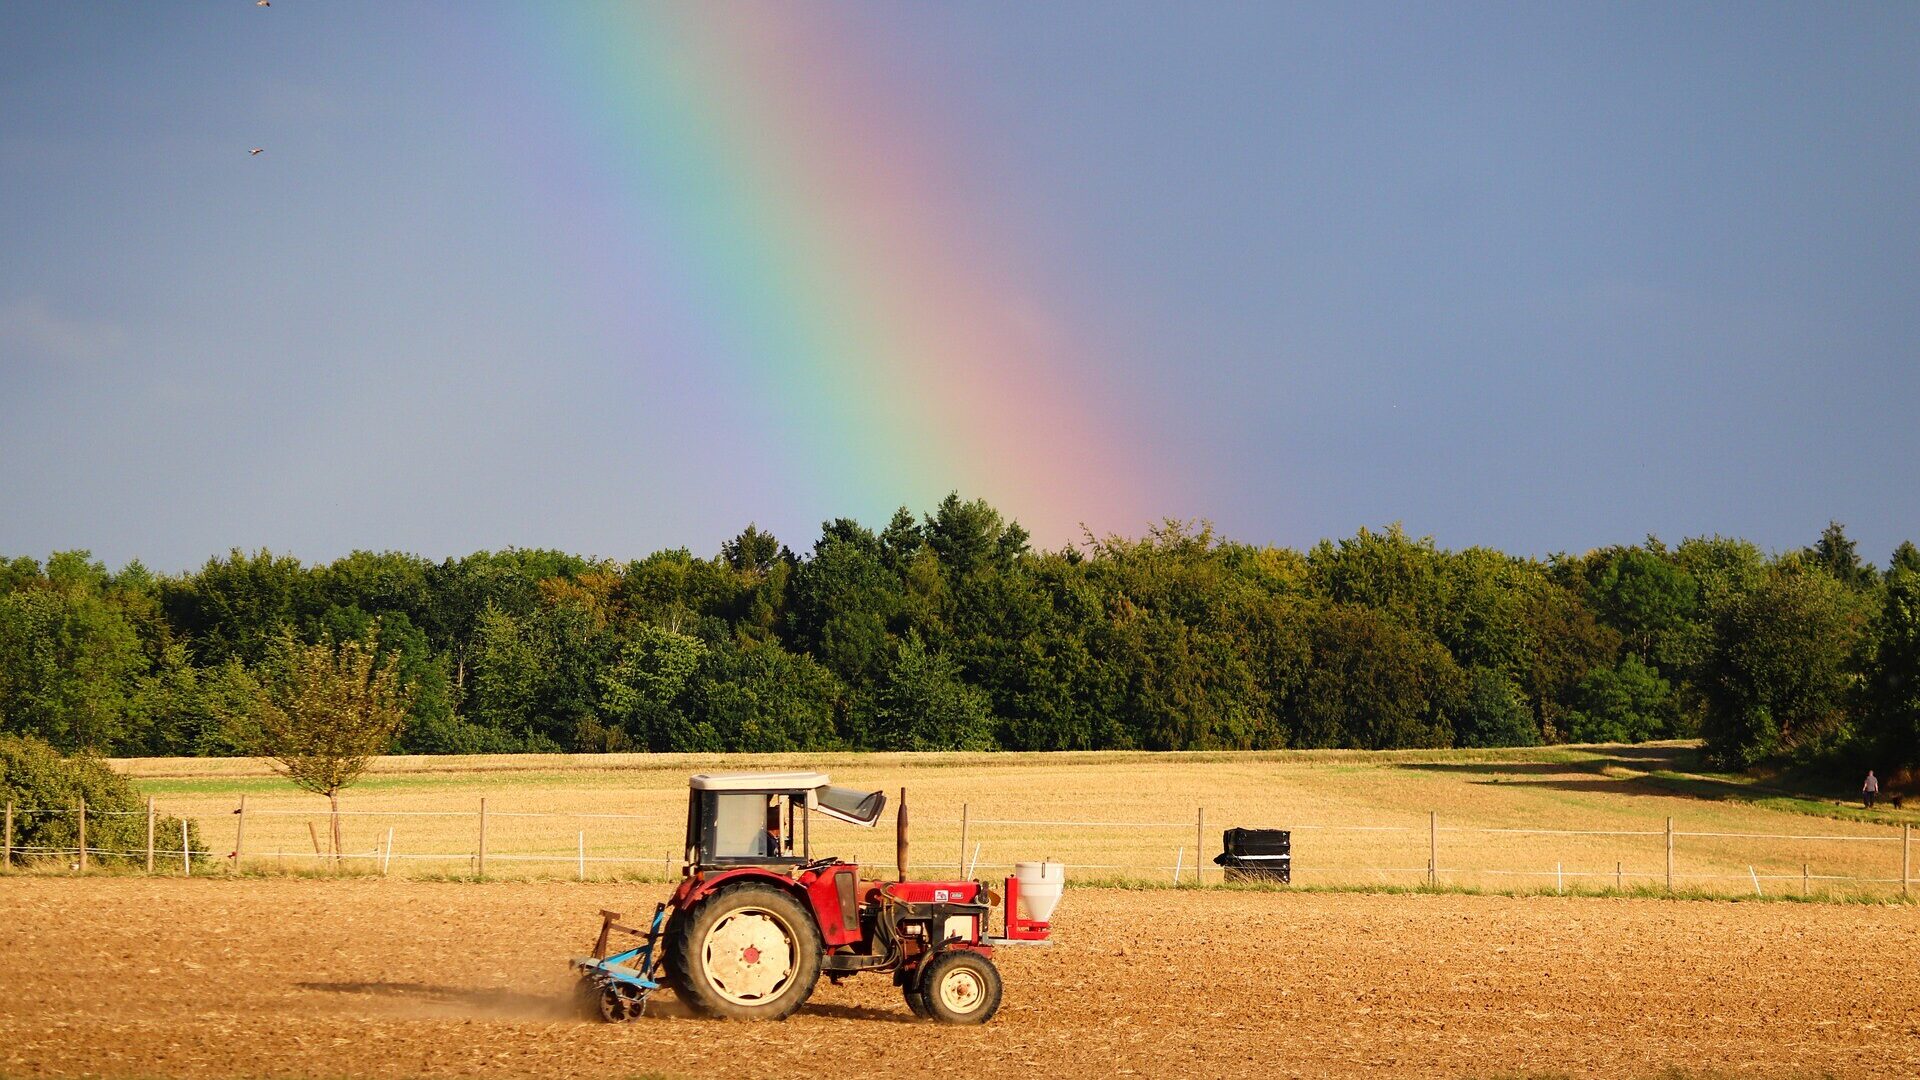
In the effort to grow better food farmers and crop advisors want to have a better understanding of the condition of their crops in real-time. Agriculture satellite imagery can allow them to detect plant stress early before damages are becoming substantial.
Remote sensing is a new revolutionary approach that can help to accomplish that. It is an affordable way to identify plant diseases and other problems early on, which can then be treated before the problem spreads and damages the entire crop. Agriculture satellite imagery leads to more efficient food production, which in turn helps to increase crop yield and decrease hunger worldwide.
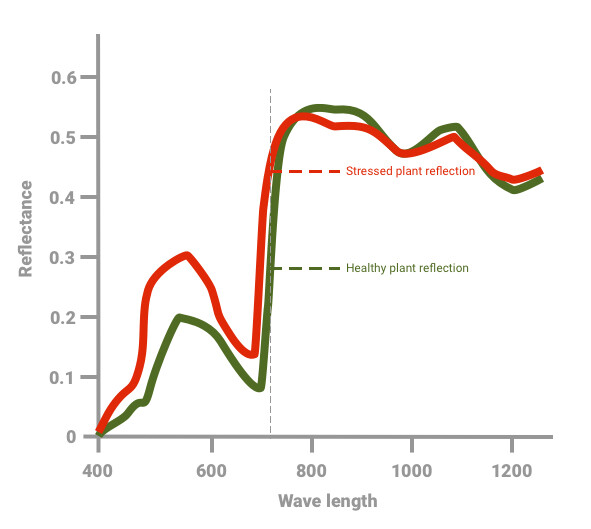
It is well known by now that the visible spectrum can be limiting when it comes to the early detection of plant stress. When you scout your plants you might not be aware of the symptoms that are already developing. These symptoms might be presented in the field but not yet visible as symptoms that are visible to the naked eye. Hyperspectral imaging can solve this problem, as it is shown to have promise in the early detection of plant stress. It was demonstrated that the symptoms of stressed plants show in some spectral regions before they can be seen in the visible spectrum.
The red-edge spectrum in agriculture satellite imagery and early plant stress detection
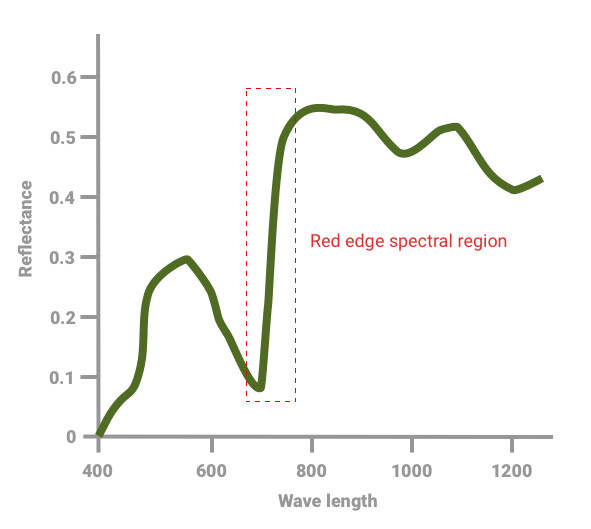
One of the interesting spectral regions is the red-edge. This is the region that shows a large sharp rise in the plant absorption of light. This region is characterized by electric waves with wavelengths between 700 to 800 nm. The sharp incline in the graph is due to the contrast between the strong absorption of chlorophyll and the otherwise reflective leaf. This spectral region is proving to be the most sensitive to disease symptoms and could serve as a leading indicator when it comes to detecting plant stress early.
This led to the increasing number of satellites that were sent to space that carry sensors that are sensitive to these wavelengths. Moreover, there is an increasing amount of research effort that deals with the classification of healthy and infested plants based on spectral signatures in the red edge spectral region. In recent years there is an increasing amount of evidence that shows that the red-edge shows signs of a problem before the condition is detectable with traditional vegetative indices or the naked eye.
Agriculture satellite imagery captured by red-edge sensors
Some of the satellites that carry red-edge sensitive sensors are the Sentinel-2 and PlantScope constellations. Sentinel-2 has spectral channels with different spatial resolutions, including three 20 m resolution red-edge bands at 705 nm, 740 nm, and 783 nm. Planetscope satellites provide 8-band including 3 m resolution with red-edge sensitivity at 733 – 748 nm.
What makes the red-edge region interesting for analysis?
Studies show that the ratio of reflectances at 750 nm to that near 700 nm is directly proportional to the chlorophyll concentration in the leaves. Chlorophyll plays a crucial role in the photosynthetic processes such as light-harvesting, and thus the content of chlorophyll is a potential indicator of a range of stresses. Moreover, it was shown that red-edge absorption analysis can indicate a problem before the actual reduction in the chlorophyll can be observed. The chlorophyll functioning changes can be detected by the red-edge analysis early on. This precedes the actual losses in leaf chlorophyll concentrations and therefore monitoring such changes can act as an early indicator for the development of biotic and abiotic stress.
Another advantage of analyzing this spectral region is the invariance of the results to changing environmental conditions. The absorption and reflectance of the waves are less sensitive to soil background and atmospheric effects.
Some examples of diseases that their monitoring was studied with this approach are late blight in potato and rice panicle blast.
Leveraging artificial intelligence to detect anomalies in satellite imagery
After discussing the benefits that can result from monitoring the red-edge reflectance we need to deal with the question of the practicality of this approach. One of the challenges in leveraging spectral analysis in stress detection is to identify the precise patterns in the satellite scans that indicate that the plants are under stress. The use of artificial intelligence in agriculture has been on the rise due to the recent advancements in technology and contributes to the efforts to overcome these challenges. Anomalies are detected using artificial intelligence by making decisions that are based on patterns that were learned from large training datasets.
The progress in the development of early detection tools can become faster once a large volume of high-quality data can be collected in an affordable way. To achieve that we took the crowdsourcing approach and built a tool that allows growers to identify plant pathology based on smartphone-captured images. Growers are directly benefiting from this service while helping to train algorithms for early detection, a capability that can be more beneficial for them in the long term. The geotagged images are used as ground truth and help us to train the algorithms to identify the problems directly from the satellite scan. The computer is presented with satellite scans in which it is known which of the field regions are diseased. We make fast progress as we are able to collect a large volume of high-quality data.
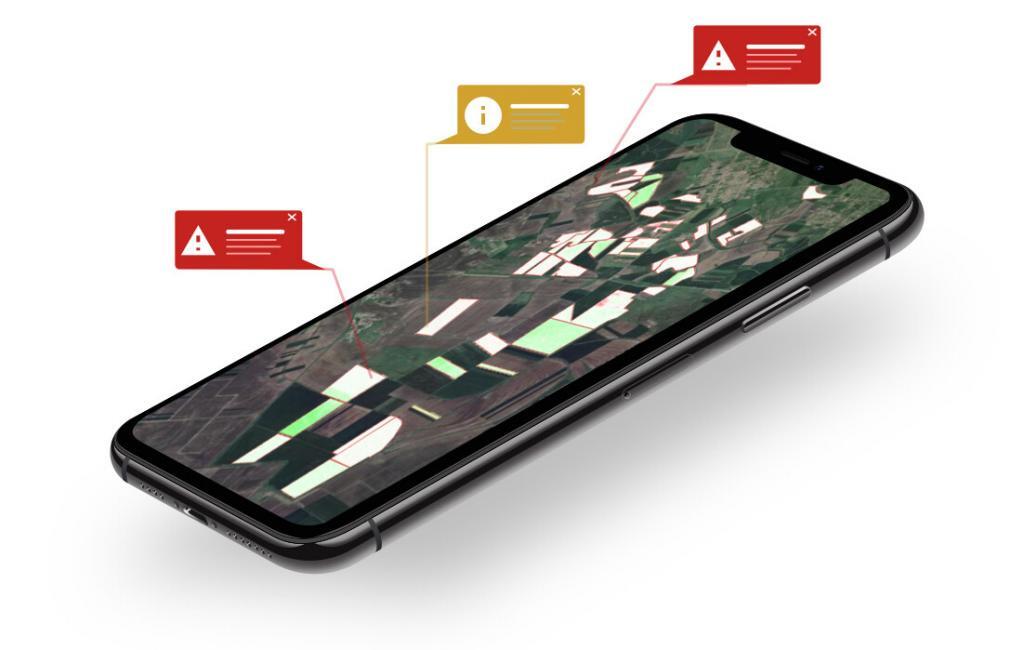
Such data allow us to learn the patterns of the typical reflectance patterns of a large number of different plant problems. We leverage these capabilities to develop easy-to-use monitoring solutions. Farmers that are using Agrio can monitor the health of their fields in a very simple way. All that is needed is to define the field location by drawing a polygon that represents the field boundary. Once this is done we are kicking in to do constant monitoring for you, and notify you when a new scan is available.
On our platform, users can get access to Sentinel and PlanetScope satellite scans. We apply our algorithm to the imagery to monitor crop progress, spot problems in the field, and alert growers when interventions are needed.
We invite you to leverage these capabilities to avoid losses, grow better, and spray less.
- The Gap Between Steps: Why the Future of Farming Isn’t Episodic
- The Silent Killer of Gardens: How to Solve Poor Drainage and Save Your Plants
- How to Reduce Plant Returns and Boost Customer Loyalty
- Gardening for Dummies: Your Guide to a Successful Growing Season
- Gardening Myths: Get the Facts with AI Pocket Agronomist