Monitoring agricultural fields tracking progress, and spotting problems in the field before symptoms are apparent is crucial for a successful harvest. Exciting advancements in technology allow us to capture images of farms worldwide with the aid of satellites, thus making monitoring simple and affordable. The most popular vegetation index used by farmers is the Normalized Difference Vegetation Index(NDVI); monitoring NDVI in agriculture can serve as an indicator of the health of plants.
What is NDVI, and why is it useful?
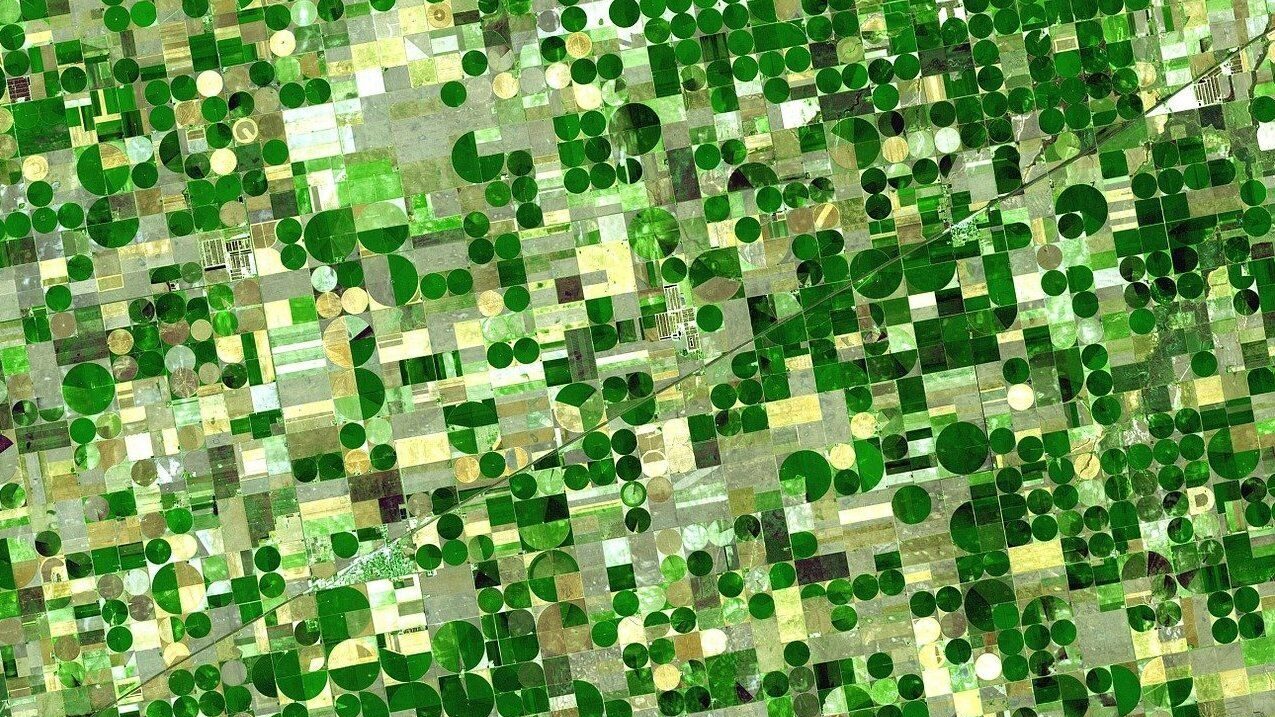
NDVI is a remote sensing method for estimating crop health and biomass. The NDVI index measures the difference between visible and near-infrared reflectance of the vegetation. Crop reflectance depends on leaf area, chlorophyll content, age of leaves, canopy density, and soil type. NDVI is often used with satellite imagery, which provides high-resolution images from space. The use of satellites has helped to make NDVI more accessible to farmers worldwide because it is accessible to anyone with an internet connection. Monitoring NDVI in agriculture for crop health screening has been around for decades. Still, it has only recently gained popularity due to the use of satellites and high-resolution aerial photography that provide frequent revisits. It gives an accurate estimate of plant biomass and leaf area index (LAI) without needing any ground data collection or manual interpretation.
How is NDVI calculated?
NDVI is calculated with the following formula:
NDVI = (NIR-Red) / (NIR+Red)
Where NIR is near-infrared light and Red is the visible red light. NDVI values range from -1 to 1. Areas of sand, rock, or snow show values of 0.1 or less. Sparse vegetation such as senescing crops shows moderate NDVI values of between 0.2 to 0.5. High NDVI values of 0.6 to 0.9 correspond to dense vegetation.
How can I start monitoring the NDVI of my fields?
Monitoring fields becomes very simple, and it does not require prior knowledge. Apps like Agrio allow you to draw your fields on the map to start the monitoring process. Once the fields’ location is defined, you will receive frequent scans and interpretations.
How to analyze NDVI imagery?
By inspecting the NDVI scans, we can better understand the fields’ situation and spot places that might show stress. For example, examine the level of green in the image below, showing different stages of plant development in the various fields, and internal variation inside individual fields.
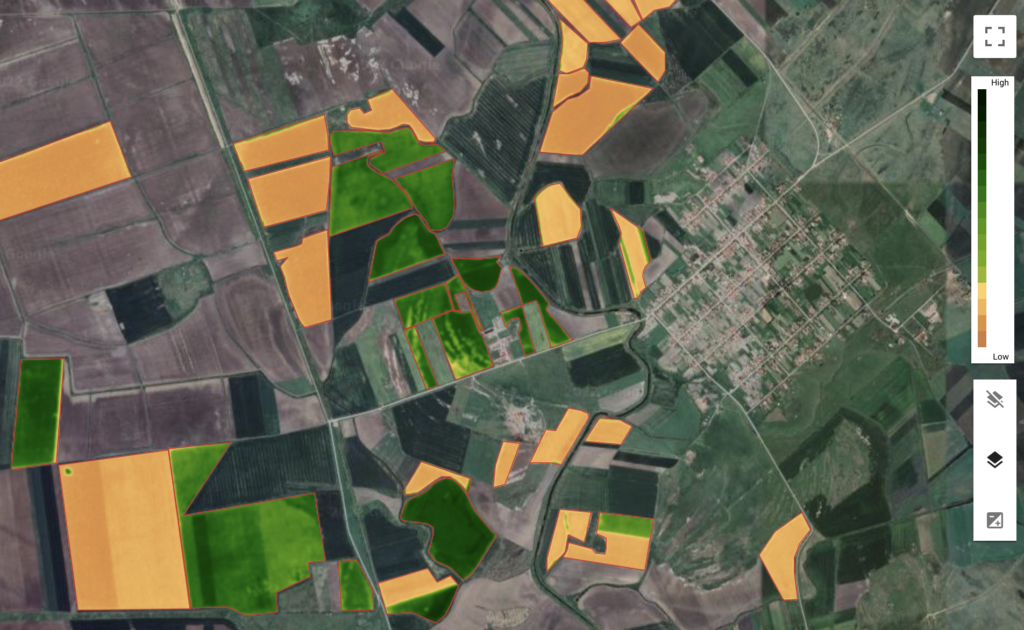
Notice the isolated green patches in the otherwise orange reading that indicates the development of weeds growth.
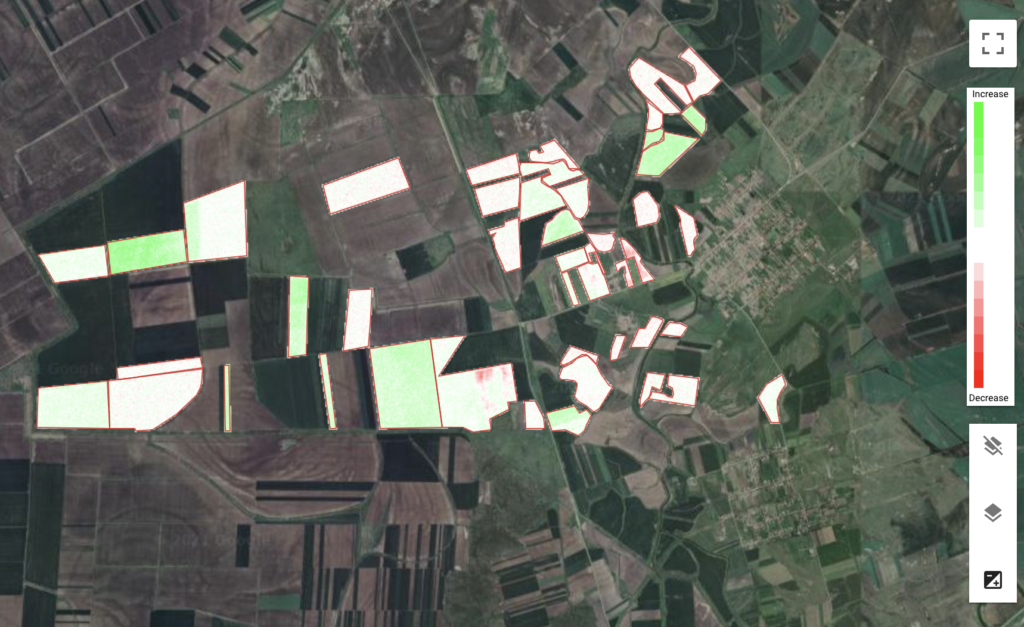
When comparing the NDVI scans of consecutive days, we can see spots that do not develop as expected and require immediate attention. For example, examine the image below and notice the red patches in fields that are in early development stages and therefore are expected to show an increase in the NDVI with time.
The limitations of NDVI in agriculture
NDVI shows a low correlation with the chlorophyll content; it is more severe in advanced growth stages when the NDVI becomes saturated. This saturation is due to the increase in the leaf area and the density of the canopy structure. Therefore, in this stage, there is a need to monitor an index that is highly correlated with the leaf chlorophyll content and less sensitive to the leaf and canopy structure.
Chlorophyll plays a crucial role in photosynthetic processes such as light-harvesting; thus, the content of chlorophyll is a potential indicator of a range of stresses. Other spectral bands can detect chlorophyll functioning changes, such as the red-edge early on. This precedes the actual losses in leaf chlorophyll concentrations; therefore, monitoring such changes can be an early indicator for developing biotic and abiotic stress.
Why technology progress makes the selection of specific vegetation indices less critical?
Since we have become very skilled in teaching computers to identify patterns in a large amount of data, selecting a specific index is not essential. Instead, artificial intelligence can analyze the entire spectrum of reflected light and provide insights. In the old days, pre-engineered features were needed to train machines to classify patterns in the data. But these days are over, and we now know how to program the machine to pick the best features during the training process.
Vegetation indices are convenient when human experts are examining the scans. It is difficult for humans to make sense of a large amount of information encoded in the full spectrum. For that purpose, it is still useful to present specific indices that experts are familiar with. But the number of monitored acres and the high frequency of satellite revisits make it less desirable for growers and agronomists to do the analysis manually.
What started as a choice due to limitations became a convention in the industry.
Leveraging artificial intelligence to detect anomalies in satellite imagery
After discussing the benefits that can result from monitoring spectral reflectance, we need to deal with the question of the practicality of this approach. One of the challenges in leveraging spectral analysis in stress detection is to identify the precise patterns in the satellite scans that indicate that the plants are under stress. Even when individuals develop the expertise of examining the scans manually, the task becomes cumbersome when the number of acres that are covered is high.
The use of artificial intelligence in agriculture has been on the rise due to the recent advancements in technology and contributes to the efforts to overcome these challenges. Anomalies are detected using artificial intelligence by making decisions that are based on patterns that were learned from large training datasets.
The progress in the development of early detection tools can become faster once a large volume of high-quality data can be collected in an affordable way. To achieve that, we took the crowdsourcing approach and built a tool that allows growers to identify plant pathology based on smartphone-captured images. Growers are directly benefiting from this service while helping to train algorithms for early detection, a capability that can be more beneficial for them in the long term. The geotagged images are used as ground truth and help us to train the algorithms to identify the problems directly from the satellite scan. The computer is presented with satellite scans in which it is known which of the field regions are diseased. We make fast progress as we can collect a large volume of high-quality data.
Such data allow us to learn the patterns of the typical reflectance patterns of a large number of different plant problems. We leverage these capabilities to develop easy-to-use monitoring solutions. Farmers using Agrio can monitor the health of their fields in a very simple way. All that is needed is to define the field location by drawing a polygon representing the field boundary. Once this is done, we are kicking in to do constant monitoring for you and notify you when a new scan is available.
Summary
Satellite monitoring in agriculture is a technique that has been used for many years. However, the use of satellite technology to monitor agricultural fields has increased significantly over the past decade. Using satellite monitoring in agriculture can increase yield, improve precision, and early detection of issues with crops.
On our platform, users can get access to Sentinel and PlanetScope satellite scans. We apply our algorithm to the imagery to monitor crop progress, spot problems in the field, and alert growers when interventions are needed.
We invite you to leverage these capabilities to avoid losses, grow better, and spray less.